Scilab World

Contour plots and density plots
2011/02/19

You can draw 3D plots of two variable functions by using ‘plot3d1’, ‘Sgrayplot’ and ‘grayplot’.
The following three plots are those examples.
clf(); //To clear the previous plot
xset('colormap', oceancolormap(32));
funcprot(0); //nothing special is done when a function is redefined
deff('z = f(x, y)', 'z = sin(x * y)');
x = linspace(0, 3, 15);
y = x;
z = feval(x, y, f); //returns the matrix z such as z(i,j)=f(x(i),y(j))
plot3d1(x, y, z, theta = 300, alpha = 40, leg = "@@", flag = [1 6 4]);
clf(); //To clear the previous plot
xset('colormap', oceancolormap(32));
funcprot(0); //nothing special is done when a function is redefined
deff('z = f(x, y)', 'z = sin(x * y)');
x = linspace(0, 3, 15);
y = x;
z = feval(x, y, f); //returns the matrix z such as z(i,j)=f(x(i),y(j))
Sgrayplot(x, y, z, strf = "041");

clf(); //To clear the previous plot
xset('colormap', oceancolormap(32));
funcprot(0); //nothing special is done when a function is redefined
deff('z = f(x, y)', 'z = sin(x * y)');
x = linspace(0, 3, 15);
y = x;
z = feval(x, y, f); //returns the matrix z such as z(i,j)=f(x(i),y(j))
grayplot(x, y, z, strf = "041");

You can get more high resolution renderings by increasing the number of plot points.
clf(); //To clear the previous plot
xset('colormap', oceancolormap(32));
funcprot(0); //nothing special is done when a function is redefined
deff('z = f(x, y)', 'z = sin(x * y)');
x = linspace(0, 3, 30);
y = x;
z = feval(x, y, f); //returns the matrix z such as z(i,j)=f(x(i),y(j))
Sgrayplot(x, y, z, strf = "041");
clf(); //To clear the previous plot
xset('colormap', oceancolormap(32));
funcprot(0); //nothing special is done when a function is redefined
deff('z = f(x, y)', 'z = sin(x * y)');
x = linspace(0, 3, 30);
y = x;
z = feval(x, y, f); //returns the matrix z such as z(i,j)=f(x(i),y(j))
grayplot(x, y, z, strf = "041");

You can also use ‘contour2d’ function.
clf(); //To clear the previous plot
xset('colormap', oceancolormap(32));
xset("fpf", "%.1f"); // changing the format of the printing of the levels
funcprot(0); //nothing special is done when a function is redefined
deff('z = f(x, y)', 'z = sin(x * y)');
x = linspace(0, 3);
y = x;
z = feval(x, y, f); //returns the matrix z such as z(i,j)=f(x(i),y(j))
contour2d(x, y, z, 5, strf = "041");
You can use ‘contour’ function with ‘plot3d1’.
clf(); //To clear the previous plot
xset('colormap', oceancolormap(128));
xset("fpf", " "); // changing the format of the printing of the levels
funcprot(0); //nothing special is done when a function is redefined
deff('z = f(x, y)', 'z = sin(x * y)');
x = linspace(0, 3);
y = x;
z = feval(x, y, f); //returns the matrix z such as z(i,j)=f(x(i),y(j))
contour(x, y, z, 5, leg = "@@", flag = [0 6 4]);
plot3d1(x, y, z, theta = 300, alpha = 40, leg = "@@", flag = [-1 6 4]);
The following three plots are other examples of ‘Sgrayplot’ , ‘grayplot’ and ‘plot3d1’,.
clf(); //To clear the previous plot
xset('colormap', oceancolormap(128));
stacksize(8000000);
funcprot(0); //nothing special is done when a function is redefined
deff('z = f(x, y)', 'z = sin(x / y)');
x = linspace(-10, 10, 500);
y = linspace(-5, 5, 500);
z = feval(x, y, f); //returns the matrix z such as z(i,j)=f(x(i),y(j))
Sgrayplot(x, y, z, strf = "041");
clf(); //To clear the previous plot
xset('colormap', oceancolormap(128));
funcprot(0); //nothing special is done when a function is redefined
deff('z = f(x, y)', 'z = sin(x / y)');
x = linspace(-10, 10, 500);
y = linspace(-5, 5, 500);
z = feval(x, y, f); //returns the matrix z such as z(i,j)=f(x(i),y(j))
grayplot(x, y, z, strf = "041");
clf(); //To clear the previous plot
xset('colormap', oceancolormap(128))
stacksize(4000000);
funcprot(0); //nothing special is done when a function is redefined
deff('z = f(x, y)', 'z = sin(x / y)');
x = linspace(-10, 10, 1000);
y = linspace(-5, 5, 1000);
z = feval(x, y, f); //returns the matrix z such as z(i,j)=f(x(i),y(j))
plot3d1(x, y, z, theta = 300, alpha = 40, leg = "@@", flag = [-1 6 4]);
You can use many options like bellow.
clf(); //To clear the previous plot
xset('colormap', springcolormap(32));
funcprot(0); //nothing special is done when a function is redefined
deff('z = f(x, y)', 'z = sin(x / y)');
x = linspace(-2, 2, 30);
y = linspace(-2, 2, 30);
z = feval(x, y, f); //returns the matrix z such as z(i,j)=f(x(i),y(j))
Sgrayplot(x, y, z, strf = "041");
xtitle('$z=\sin\frac{x}{y}$');
f = gcf();
n = size(f.color_map, "r"); //get the colormap size
a = gca(); //get the current axes
a.title.font_foreground = 1/5*n;
a.title.font_size = 4;
a.title.auto_position = "off";
a.title.position = [-0.5, 2.0];
a.parent.background = 4/5*n;
a.labels_font_color = 1/5*n;
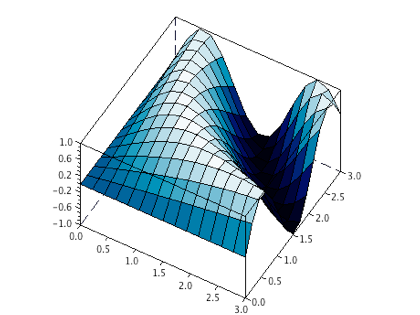
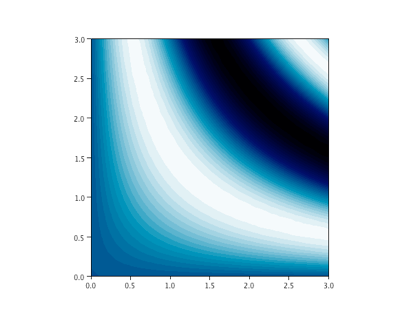
The following three plots are those examples.
clf(); //To clear the previous plot
xset('colormap', oceancolormap(32));
funcprot(0); //nothing special is done when a function is redefined
deff('z = f(x, y)', 'z = sin(x * y)');
x = linspace(0, 3, 15);
y = x;
z = feval(x, y, f); //returns the matrix z such as z(i,j)=f(x(i),y(j))
plot3d1(x, y, z, theta = 300, alpha = 40, leg = "@@", flag = [1 6 4]);
clf(); //To clear the previous plot
xset('colormap', oceancolormap(32));
funcprot(0); //nothing special is done when a function is redefined
deff('z = f(x, y)', 'z = sin(x * y)');
x = linspace(0, 3, 15);
y = x;
z = feval(x, y, f); //returns the matrix z such as z(i,j)=f(x(i),y(j))
Sgrayplot(x, y, z, strf = "041");
clf(); //To clear the previous plot
xset('colormap', oceancolormap(32));
funcprot(0); //nothing special is done when a function is redefined
deff('z = f(x, y)', 'z = sin(x * y)');
x = linspace(0, 3, 15);
y = x;
z = feval(x, y, f); //returns the matrix z such as z(i,j)=f(x(i),y(j))
grayplot(x, y, z, strf = "041");
You can get more high resolution renderings by increasing the number of plot points.
clf(); //To clear the previous plot
xset('colormap', oceancolormap(32));
funcprot(0); //nothing special is done when a function is redefined
deff('z = f(x, y)', 'z = sin(x * y)');
x = linspace(0, 3, 30);
y = x;
z = feval(x, y, f); //returns the matrix z such as z(i,j)=f(x(i),y(j))
Sgrayplot(x, y, z, strf = "041");
clf(); //To clear the previous plot
xset('colormap', oceancolormap(32));
funcprot(0); //nothing special is done when a function is redefined
deff('z = f(x, y)', 'z = sin(x * y)');
x = linspace(0, 3, 30);
y = x;
z = feval(x, y, f); //returns the matrix z such as z(i,j)=f(x(i),y(j))
grayplot(x, y, z, strf = "041");
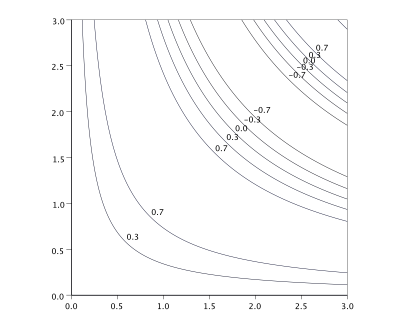
You can also use ‘contour2d’ function.
clf(); //To clear the previous plot
xset('colormap', oceancolormap(32));
xset("fpf", "%.1f"); // changing the format of the printing of the levels
funcprot(0); //nothing special is done when a function is redefined
deff('z = f(x, y)', 'z = sin(x * y)');
x = linspace(0, 3);
y = x;
z = feval(x, y, f); //returns the matrix z such as z(i,j)=f(x(i),y(j))
contour2d(x, y, z, 5, strf = "041");
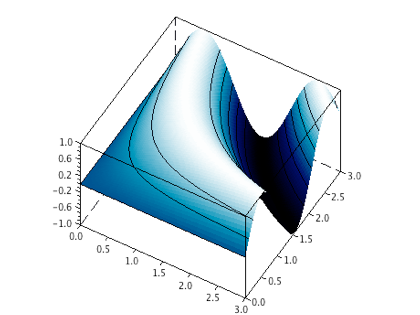
You can use ‘contour’ function with ‘plot3d1’.
clf(); //To clear the previous plot
xset('colormap', oceancolormap(128));
xset("fpf", " "); // changing the format of the printing of the levels
funcprot(0); //nothing special is done when a function is redefined
deff('z = f(x, y)', 'z = sin(x * y)');
x = linspace(0, 3);
y = x;
z = feval(x, y, f); //returns the matrix z such as z(i,j)=f(x(i),y(j))
contour(x, y, z, 5, leg = "@@", flag = [0 6 4]);
plot3d1(x, y, z, theta = 300, alpha = 40, leg = "@@", flag = [-1 6 4]);
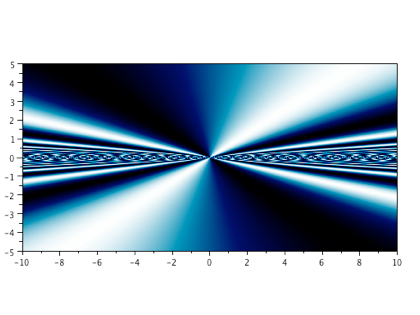
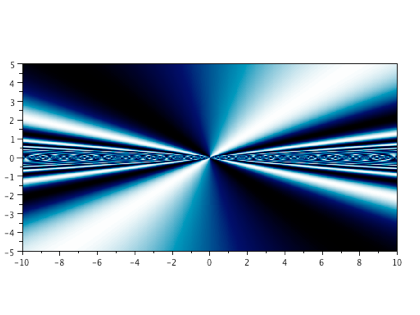
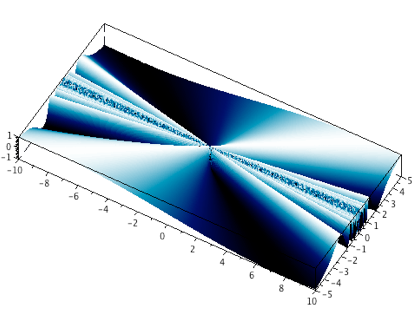
The following three plots are other examples of ‘Sgrayplot’ , ‘grayplot’ and ‘plot3d1’,.
clf(); //To clear the previous plot
xset('colormap', oceancolormap(128));
stacksize(8000000);
funcprot(0); //nothing special is done when a function is redefined
deff('z = f(x, y)', 'z = sin(x / y)');
x = linspace(-10, 10, 500);
y = linspace(-5, 5, 500);
z = feval(x, y, f); //returns the matrix z such as z(i,j)=f(x(i),y(j))
Sgrayplot(x, y, z, strf = "041");
clf(); //To clear the previous plot
xset('colormap', oceancolormap(128));
funcprot(0); //nothing special is done when a function is redefined
deff('z = f(x, y)', 'z = sin(x / y)');
x = linspace(-10, 10, 500);
y = linspace(-5, 5, 500);
z = feval(x, y, f); //returns the matrix z such as z(i,j)=f(x(i),y(j))
grayplot(x, y, z, strf = "041");
clf(); //To clear the previous plot
xset('colormap', oceancolormap(128))
stacksize(4000000);
funcprot(0); //nothing special is done when a function is redefined
deff('z = f(x, y)', 'z = sin(x / y)');
x = linspace(-10, 10, 1000);
y = linspace(-5, 5, 1000);
z = feval(x, y, f); //returns the matrix z such as z(i,j)=f(x(i),y(j))
plot3d1(x, y, z, theta = 300, alpha = 40, leg = "@@", flag = [-1 6 4]);
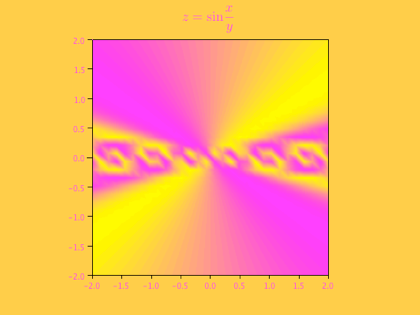
You can use many options like bellow.
clf(); //To clear the previous plot
xset('colormap', springcolormap(32));
funcprot(0); //nothing special is done when a function is redefined
deff('z = f(x, y)', 'z = sin(x / y)');
x = linspace(-2, 2, 30);
y = linspace(-2, 2, 30);
z = feval(x, y, f); //returns the matrix z such as z(i,j)=f(x(i),y(j))
Sgrayplot(x, y, z, strf = "041");
xtitle('$z=\sin\frac{x}{y}$');
f = gcf();
n = size(f.color_map, "r"); //get the colormap size
a = gca(); //get the current axes
a.title.font_foreground = 1/5*n;
a.title.font_size = 4;
a.title.auto_position = "off";
a.title.position = [-0.5, 2.0];
a.parent.background = 4/5*n;
a.labels_font_color = 1/5*n;
You can draw 3D plots of two variable functions by using ‘plot3d1’, ‘Sgrayplot’ and ‘grayplot’.


