Scilab World

2D plots of functions
2011/02/27
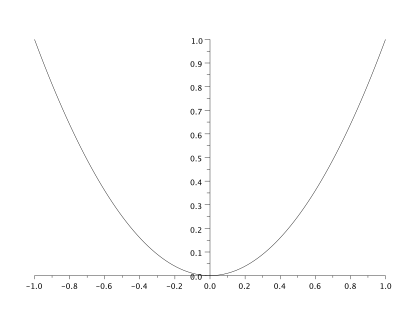
You can draw 2D plots of function by using ‘plot2d.’
clf(); //To clear the previous plot
x = linspace(-1, 1);
plot2d(x, x^2);
a = gca(); //get the current axes
a.x_location = "origin";
a.y_location = "origin";
clf(); //To clear the previous plot
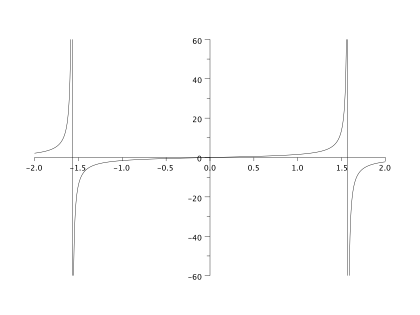
x = linspace(-2, 2, 1000);
plot2d(x, tan(x));
a = gca(); //get the current axes
a.x_location = "origin";
a.y_location = "origin";
a.data_bounds = [-2,-60;2,60];
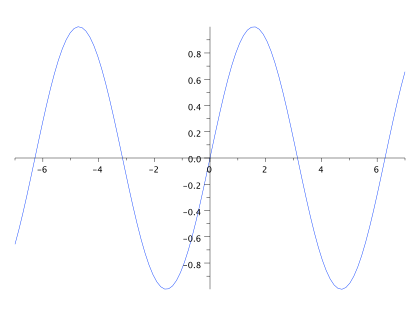
clf(); //To clear the previous plot
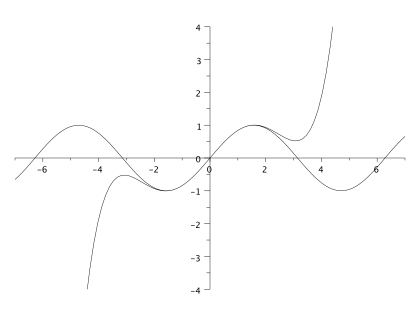
x = linspace(-7, 7);
plot2d(x, sin(x));
plot2d(x, x - x^3/6 + x^5/120);
a = gca(); //get the current axes
a.x_location = "origin";
a.y_location = "origin";
a.data_bounds = [-7,-4;7,4];
a.tight_limits = "on";
clf(); //To clear the previous plot
x = linspace(-7, 7);
plot2d(x, sin(x));
e=gce(); // store the Compound containing the plot
e.children(1).foreground = 2;
a = gca(); //get the current axes
a.x_location = "origin";
a.y_location = "origin";
a.tight_limits = "on";
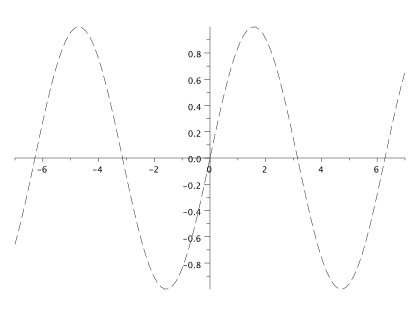
clf(); //To clear the previous plot
x = linspace(-7, 7);
plot2d(x, sin(x));
e=gce(); // store the Compound containing the plot
e.children(1).line_style = 2;
a = gca(); //get the current axes
a.x_location = "origin";
a.y_location = "origin";
a.tight_limits = "on";
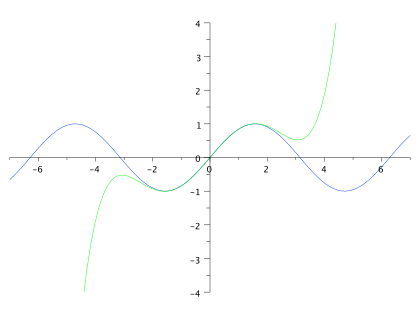
clf(); //To clear the previous plot
x = linspace(-7, 7);
plot2d(x, sin(x));
e=gce(); // store the Compound containing the plot
e.children(1).foreground = 2;
plot2d(x, x - x^3/6 + x^5/120);
e=gce(); // store the Compound containing the plot
e.children(1).foreground = 3;
a = gca(); //get the current axes
a.x_location = "origin";
a.y_location = "origin";
a.data_bounds = [-7,-4;7,4];
a.tight_limits = "on";
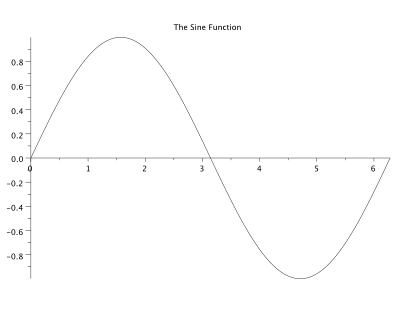
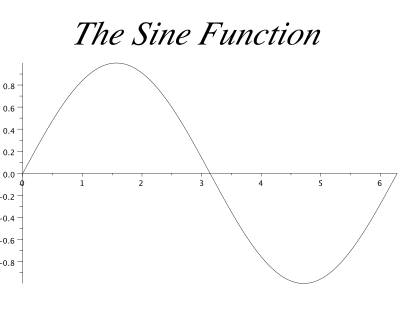
clf(); //To clear the previous plot
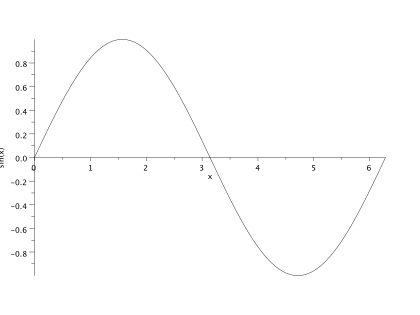
x = linspace(0, 2*%pi);
plot2d(x, sin(x));
a = gca(); //get the current axes
a.x_location = "origin";
a.y_location = "origin";
a.tight_limits = "on";
xtitle('The Sine Function');
clf(); //To clear the previous plot
x = linspace(0, 2*%pi);
plot2d(x, sin(x));
a = gca(); //get the current axes
a.x_location = "origin";
a.y_location = "origin";
a.tight_limits = "on";
xtitle('', 'x', 'sin(x)');
clf(); //To clear the previous plot
x = linspace(0, 2*%pi);
plot2d(x, sin(x));
a = gca(); //get the current axes
a.x_location = "origin";
a.y_location = "left";
a.tight_limits = "on";
a.box = "on";
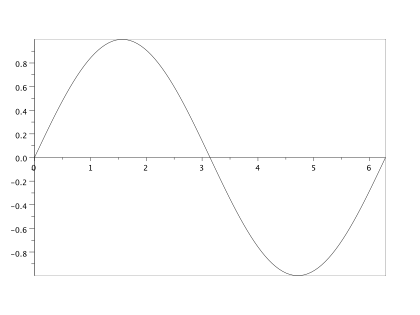
clf(); //To clear the previous plot
x = linspace(0, 2*%pi);
plot2d(x, sin(x));
a = gca(); //get the current axes
a.x_location = "bottom";
a.y_location = "left";
a.tight_limits = "on";
a.box = "on";
a.grid = [2,2];
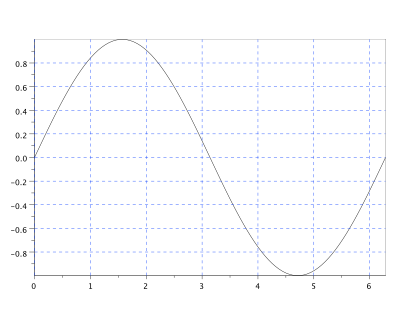
clf(); //To clear the previous plot
x = linspace(0, 2*%pi);
plot2d(x, sin(x));
a = gca(); //get the current axes
a.x_location = "origin";
a.y_location = "origin";
a.tight_limits = "on";
a.font_style = 1; //1 to 10
a.font_size = 7;
a.margins = [0.2,0.1,0.1,0.1];
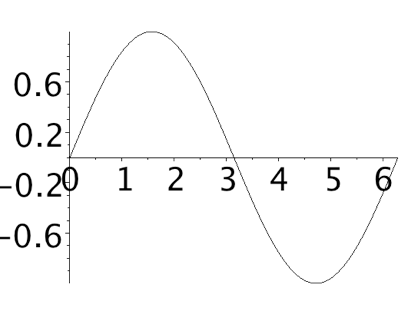
clf(); //To clear the previous plot
x = linspace(0, 2*%pi);
plot2d(x, sin(x));
a = gca(); //get the current axes
a.x_location = "origin";
a.y_location = "origin";
a.tight_limits = "on";
xtitle('The Sine Function');
a.title.font_style = 3; //1 to 10
a.title.font_size = 7;
a.margins = [0.1,0.1,0.2,0.1];
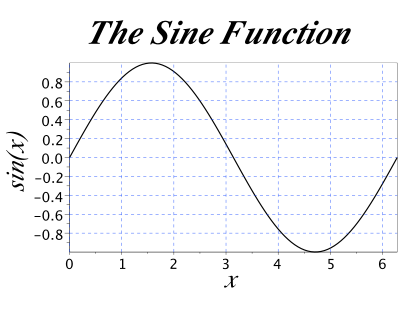
clf(); //To clear the previous plot
x = linspace(0, 2*%pi);
plot2d(x, sin(x));
e=gce(); // store the Compound containing the plot
e.children(1).thickness = 3;
a = gca(); //get the current axes
a.x_location = "bottom";
a.y_location = "left";
a.tight_limits = "on";
a.box = "on";
a.grid = [2,2];
xtitle('The Sine Function', 'x', 'sin(x)');
a.title.font_style = 5; //1 to 10
a.title.font_size = 7;
a.x_label.font_style = 3; //1 to 10
a.x_label.font_size = 6;
a.y_label.font_style = 3; //1 to 10
a.y_label.font_size = 6;
a.font_style = 6; //1 to 10
a.font_size = 4;
a.margins = [0.2,0.1,0.2,0.2];
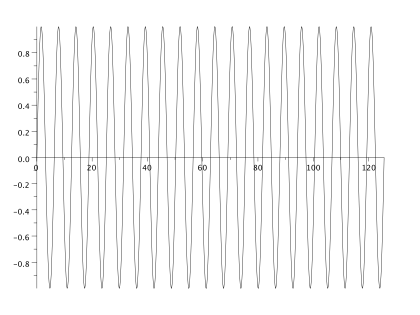
clf(); //To clear the previous plot
x = linspace(0, 40*%pi, 1000);
plot2d(x, sin(x));
a = gca(); //get the current axes
a.x_location = "origin";
a.y_location = "origin";
a.tight_limits = "on";
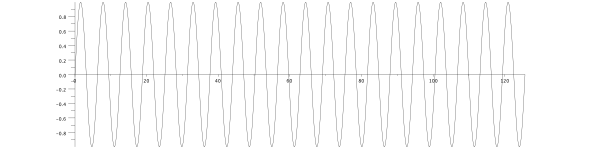
clf(); //To clear the previous plot
x = linspace(0, 40*%pi, 1000);
plot2d(x, sin(x));
f = gcf();
AxesSizeX = f.axes_size(1);
AxesSizeY = f.axes_size(2);
AspectRatio = 0.2;
f.axes_size = [AxesSizeY/AspectRatio, AxesSizeY];
a = gca(); //get the current axes
a.x_location = "origin";
a.y_location = "origin";
a.tight_limits = "on";
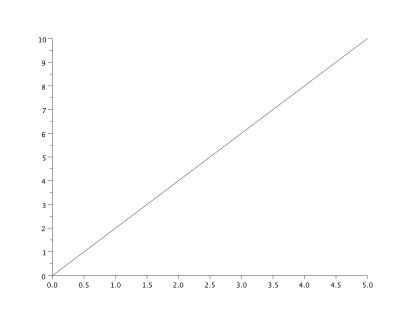
clf(); //To clear the previous plot
x = linspace(0, 5);
plot2d(x, 2*x);
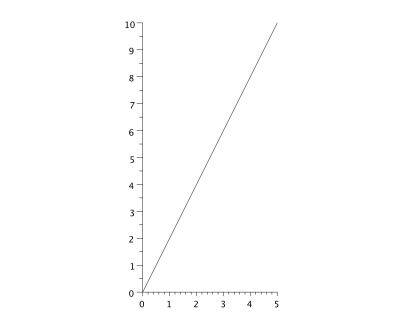
clf(); //To clear the previous plot
x = linspace(0, 5);
plot2d(x, 2*x);
a = gca(); //get the current axes
a.isoview = "on";
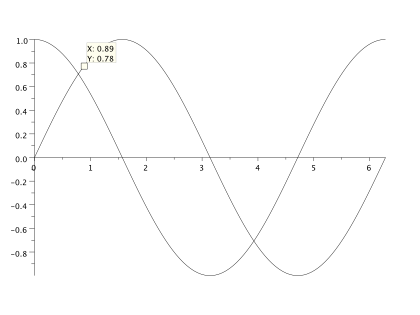
clf(); //To clear the previous plot
x = linspace(0, 2*%pi);
plot2d(x, sin(x));
plot2d(x, cos(x));
a = gca(); //get the current axes
a.x_location = "origin";
a.y_location = "origin";
a.tight_limits = "on";
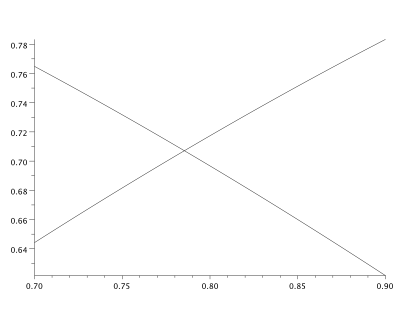
clf(); //To clear the previous plot
x = linspace(0.7, 0.9);
plot2d(x, sin(x));
plot2d(x, cos(x));
a = gca(); //get the current axes
a.tight_limits = "on";
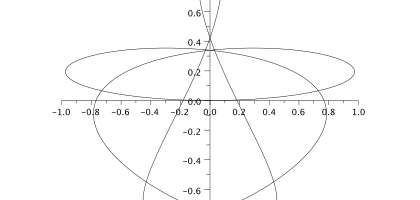
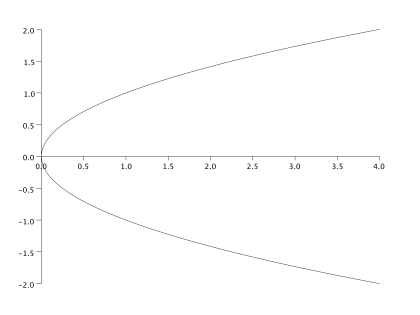
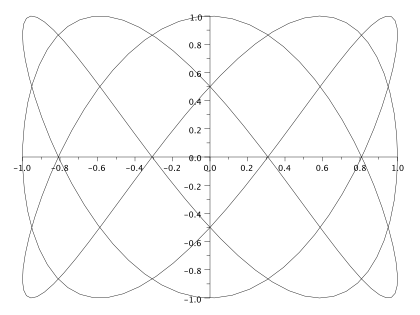
You can draw 2D plots of parametric equations by using ‘plot2d.’
clf(); //To clear the previous plot
t = linspace(-2, 2);
plot2d(t^2, t);
a = gca(); //get the current axes
a.x_location = "origin";
a.y_location = "origin";
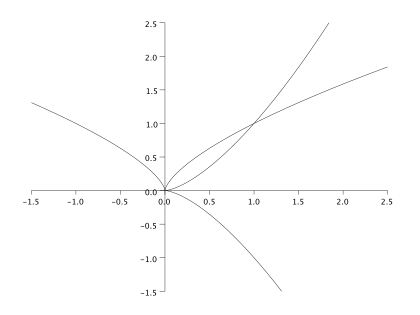
clf(); //To clear the previous plot
t = linspace(-2, 2);
plot2d([t^3 t^2], [t^2 t^3]);
a = gca(); //get the current axes
a.x_location = "origin";
a.y_location = "origin";
a.data_bounds = [-1.5,-1.5;2.5,2.5];
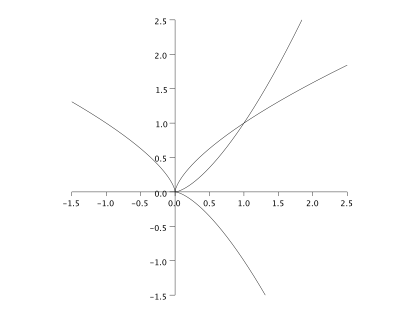
clf(); //To clear the previous plot
t = linspace(-2, 2);
plot2d([t^3 t^2], [t^2 t^3]);
a = gca(); //get the current axes
a.x_location = "origin";
a.y_location = "origin";
a.data_bounds = [-1.5,-1.5;2.5,2.5];
a.isoview = "on";
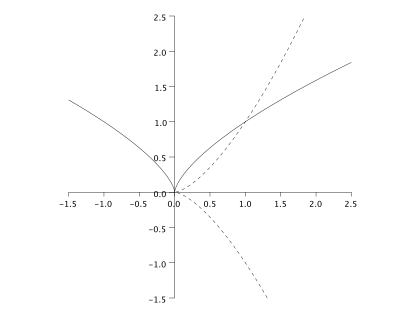
clf(); //To clear the previous plot
t = linspace(-2, 2);
plot2d(t^3, t^2);
plot2d(t^2, t^3);
e=gce(); // store the Compound containing the plot
e.children(1).line_style = 3;
a = gca(); //get the current axes
a.x_location = "origin";
a.y_location = "origin";
a.data_bounds = [-1.5,-1.5;2.5,2.5];
a.isoview = "on";
clf(); //To clear the previous plot
t = linspace(0, 2*%pi, 200);
plot2d(cos(3*t), sin(5*t));
a = gca(); //get the current axes
a.x_location = "origin";
a.y_location = "origin";
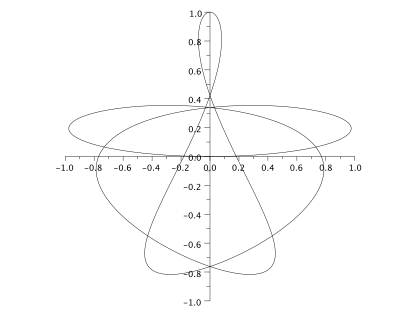
clf(); //To clear the previous plot
t = linspace(0, 2*%pi, 1000);
plot2d(sin(7*t).*cos(t), sin(5*t).*sin(t));
a = gca(); //get the current axes
a.x_location = "origin";
a.y_location = "origin";
a.isoview = "on";
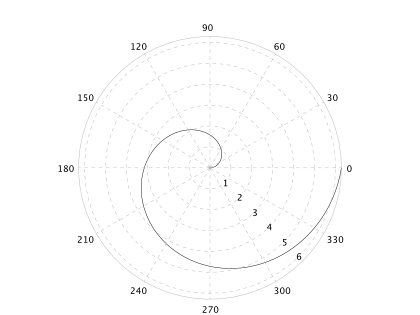
clf(); //To clear the previous plot
t = linspace(0, 2*%pi);
polarplot(t, t);
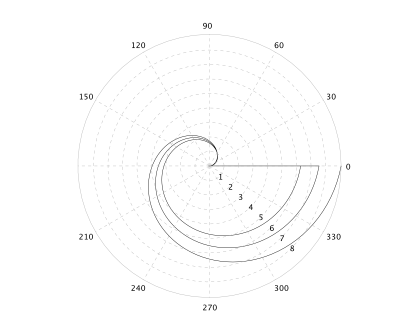
clf(); //To clear the previous plot
t = linspace(0, 2*%pi);
polarplot([t, t, t], [t, t^1.1, t^1.2]);
clf(); //To clear the previous plot
t = linspace(0, 2*%pi);
polarplot(t, 1);
clf(); //To clear the previous plot
x = linspace(-1, 1);
plot2d(x, x^2);
a = gca(); //get the current axes
a.x_location = "origin";
a.y_location = "origin";
clf(); //To clear the previous plot
x = linspace(-2, 2, 1000);
plot2d(x, tan(x));
a = gca(); //get the current axes
a.x_location = "origin";
a.y_location = "origin";
a.data_bounds = [-2,-60;2,60];
clf(); //To clear the previous plot
x = linspace(-7, 7);
plot2d(x, sin(x));
plot2d(x, x - x^3/6 + x^5/120);
a = gca(); //get the current axes
a.x_location = "origin";
a.y_location = "origin";
a.data_bounds = [-7,-4;7,4];
a.tight_limits = "on";
clf(); //To clear the previous plot
x = linspace(-7, 7);
plot2d(x, sin(x));
e=gce(); // store the Compound containing the plot
e.children(1).foreground = 2;
a = gca(); //get the current axes
a.x_location = "origin";
a.y_location = "origin";
a.tight_limits = "on";
clf(); //To clear the previous plot
x = linspace(-7, 7);
plot2d(x, sin(x));
e=gce(); // store the Compound containing the plot
e.children(1).line_style = 2;
a = gca(); //get the current axes
a.x_location = "origin";
a.y_location = "origin";
a.tight_limits = "on";
clf(); //To clear the previous plot
x = linspace(-7, 7);
plot2d(x, sin(x));
e=gce(); // store the Compound containing the plot
e.children(1).foreground = 2;
plot2d(x, x - x^3/6 + x^5/120);
e=gce(); // store the Compound containing the plot
e.children(1).foreground = 3;
a = gca(); //get the current axes
a.x_location = "origin";
a.y_location = "origin";
a.data_bounds = [-7,-4;7,4];
a.tight_limits = "on";
clf(); //To clear the previous plot
x = linspace(0, 2*%pi);
plot2d(x, sin(x));
a = gca(); //get the current axes
a.x_location = "origin";
a.y_location = "origin";
a.tight_limits = "on";
xtitle('The Sine Function');
clf(); //To clear the previous plot
x = linspace(0, 2*%pi);
plot2d(x, sin(x));
a = gca(); //get the current axes
a.x_location = "origin";
a.y_location = "origin";
a.tight_limits = "on";
xtitle('', 'x', 'sin(x)');
clf(); //To clear the previous plot
x = linspace(0, 2*%pi);
plot2d(x, sin(x));
a = gca(); //get the current axes
a.x_location = "origin";
a.y_location = "left";
a.tight_limits = "on";
a.box = "on";
clf(); //To clear the previous plot
x = linspace(0, 2*%pi);
plot2d(x, sin(x));
a = gca(); //get the current axes
a.x_location = "bottom";
a.y_location = "left";
a.tight_limits = "on";
a.box = "on";
a.grid = [2,2];
clf(); //To clear the previous plot
x = linspace(0, 2*%pi);
plot2d(x, sin(x));
a = gca(); //get the current axes
a.x_location = "origin";
a.y_location = "origin";
a.tight_limits = "on";
a.font_style = 1; //1 to 10
a.font_size = 7;
a.margins = [0.2,0.1,0.1,0.1];
clf(); //To clear the previous plot
x = linspace(0, 2*%pi);
plot2d(x, sin(x));
a = gca(); //get the current axes
a.x_location = "origin";
a.y_location = "origin";
a.tight_limits = "on";
xtitle('The Sine Function');
a.title.font_style = 3; //1 to 10
a.title.font_size = 7;
a.margins = [0.1,0.1,0.2,0.1];
clf(); //To clear the previous plot
x = linspace(0, 2*%pi);
plot2d(x, sin(x));
e=gce(); // store the Compound containing the plot
e.children(1).thickness = 3;
a = gca(); //get the current axes
a.x_location = "bottom";
a.y_location = "left";
a.tight_limits = "on";
a.box = "on";
a.grid = [2,2];
xtitle('The Sine Function', 'x', 'sin(x)');
a.title.font_style = 5; //1 to 10
a.title.font_size = 7;
a.x_label.font_style = 3; //1 to 10
a.x_label.font_size = 6;
a.y_label.font_style = 3; //1 to 10
a.y_label.font_size = 6;
a.font_style = 6; //1 to 10
a.font_size = 4;
a.margins = [0.2,0.1,0.2,0.2];
clf(); //To clear the previous plot
x = linspace(0, 40*%pi, 1000);
plot2d(x, sin(x));
a = gca(); //get the current axes
a.x_location = "origin";
a.y_location = "origin";
a.tight_limits = "on";
clf(); //To clear the previous plot
x = linspace(0, 40*%pi, 1000);
plot2d(x, sin(x));
f = gcf();
AxesSizeX = f.axes_size(1);
AxesSizeY = f.axes_size(2);
AspectRatio = 0.2;
f.axes_size = [AxesSizeY/AspectRatio, AxesSizeY];
a = gca(); //get the current axes
a.x_location = "origin";
a.y_location = "origin";
a.tight_limits = "on";
clf(); //To clear the previous plot
x = linspace(0, 5);
plot2d(x, 2*x);
clf(); //To clear the previous plot
x = linspace(0, 5);
plot2d(x, 2*x);
a = gca(); //get the current axes
a.isoview = "on";
clf(); //To clear the previous plot
x = linspace(0, 2*%pi);
plot2d(x, sin(x));
plot2d(x, cos(x));
a = gca(); //get the current axes
a.x_location = "origin";
a.y_location = "origin";
a.tight_limits = "on";
clf(); //To clear the previous plot
x = linspace(0.7, 0.9);
plot2d(x, sin(x));
plot2d(x, cos(x));
a = gca(); //get the current axes
a.tight_limits = "on";
You can draw 2D plots of parametric equations by using ‘plot2d.’
clf(); //To clear the previous plot
t = linspace(-2, 2);
plot2d(t^2, t);
a = gca(); //get the current axes
a.x_location = "origin";
a.y_location = "origin";
clf(); //To clear the previous plot
t = linspace(-2, 2);
plot2d([t^3 t^2], [t^2 t^3]);
a = gca(); //get the current axes
a.x_location = "origin";
a.y_location = "origin";
a.data_bounds = [-1.5,-1.5;2.5,2.5];
clf(); //To clear the previous plot
t = linspace(-2, 2);
plot2d([t^3 t^2], [t^2 t^3]);
a = gca(); //get the current axes
a.x_location = "origin";
a.y_location = "origin";
a.data_bounds = [-1.5,-1.5;2.5,2.5];
a.isoview = "on";
clf(); //To clear the previous plot
t = linspace(-2, 2);
plot2d(t^3, t^2);
plot2d(t^2, t^3);
e=gce(); // store the Compound containing the plot
e.children(1).line_style = 3;
a = gca(); //get the current axes
a.x_location = "origin";
a.y_location = "origin";
a.data_bounds = [-1.5,-1.5;2.5,2.5];
a.isoview = "on";
clf(); //To clear the previous plot
t = linspace(0, 2*%pi, 200);
plot2d(cos(3*t), sin(5*t));
a = gca(); //get the current axes
a.x_location = "origin";
a.y_location = "origin";
clf(); //To clear the previous plot
t = linspace(0, 2*%pi, 1000);
plot2d(sin(7*t).*cos(t), sin(5*t).*sin(t));
a = gca(); //get the current axes
a.x_location = "origin";
a.y_location = "origin";
a.isoview = "on";
clf(); //To clear the previous plot
t = linspace(0, 2*%pi);
polarplot(t, t);
clf(); //To clear the previous plot
t = linspace(0, 2*%pi);
polarplot([t, t, t], [t, t^1.1, t^1.2]);
clf(); //To clear the previous plot
t = linspace(0, 2*%pi);
polarplot(t, 1);
You can draw 2D plots of function by using ‘plot2d.’


