Scilab World

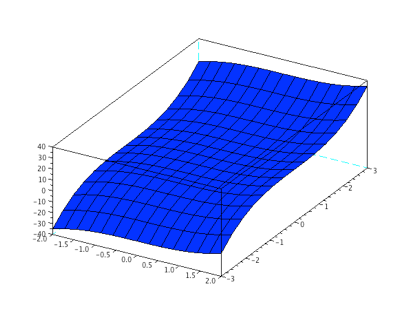
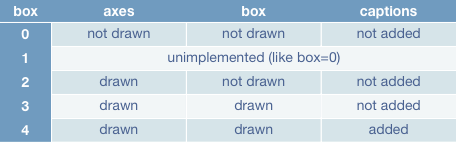
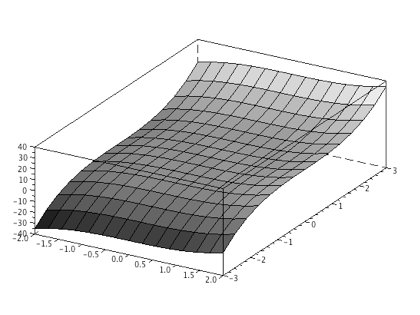
You can draw 3D plot of two variable functions by ‘plot3d.’
clf(); //To clear the previous plot
funcprot(0); //nothing special is done when a function is redefined
deff('z = f(x, y)', 'z = x^3 + y^3');
x = linspace(-2, 2, 15);
y = linspace(-3, 3, 15);
z = feval(x, y, f); //returns the matrix z such as z(i,j)=f(x(i),y(j))
plot3d(x, y, z, theta = 300, alpha = 3, leg = "@@");
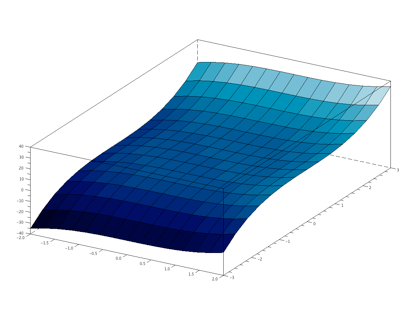
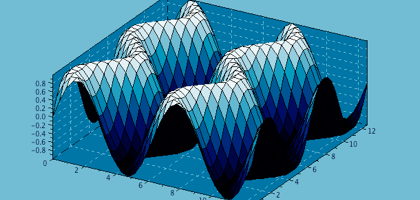
If you want to draw color level plot, you should use ‘plot3d1’ with xset('colormap', cmap)
clf(); //To clear the previous plot
xset('colormap', oceancolormap(32))
funcprot(0); //nothing special is done when a function is redefined
deff('z = f(x, y)', 'z = x^3 + y^3')
x = linspace(-2, 2, 15);
y = linspace(-3, 3, 15);
z = feval(x, y, f); //returns the matrix z such as z(i,j)=f(x(i),y(j))
plot3d1(x, y, z, theta = 300, alpha = 3, leg="@@");
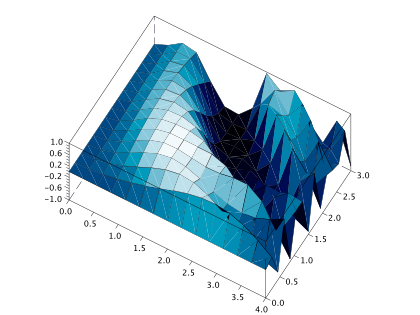
If you draw the function as below, you are failed in describing details.
clf(); //To clear the previous plot
xset('colormap', oceancolormap(32));
funcprot(0); //nothing special is done when a function is redefined
deff('z = f(x, y)', 'z = sin(x * sin(x * y))');
x = linspace(0, 4, 15);
y = linspace(0, 3, 15);
z = feval(x, y, f); //returns the matrix z such as z(i,j)=f(x(i),y(j))
plot3d1(x, y, z, theta = 300, alpha = 30, leg = "@@", flag = [1 6 4]);
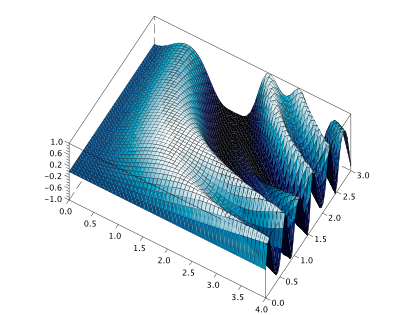
You should increase number of plot points for this function.
clf(); //To clear the previous plot
xset('colormap', oceancolormap(32));
funcprot(0); //nothing special is done when a function is redefined
deff('z = f(x, y)', 'z = sin(x * sin(x * y))');
x = linspace(0, 4, 50);
y = linspace(0, 3, 50);
z = feval(x, y, f); //returns the matrix z such as z(i,j)=f(x(i),y(j))
plot3d1(x, y, z, theta = 300, alpha = 30, leg = "@@", flag = [1 6 4]);
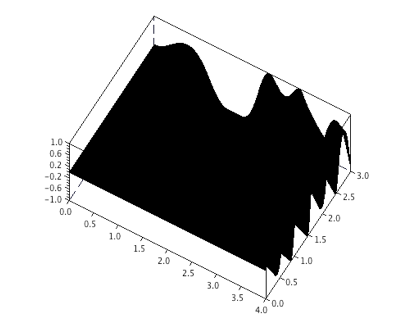
If you draw too many plot points, output graphic become black as below.
clf(); //To clear the previous plot
xset('colormap', oceancolormap(32));
funcprot(0); //nothing special is done when a function is redefined
deff('z = f(x, y)', 'z = sin(x * sin(x * y))');
x = linspace(0, 4, 500);
y = linspace(0, 3, 500);
z = feval(x, y, f); //returns the matrix z such as z(i,j)=f(x(i),y(j))
plot3d1(x, y, z, theta = 300, alpha = 30, leg = "@@", flag = [1 6 4]);
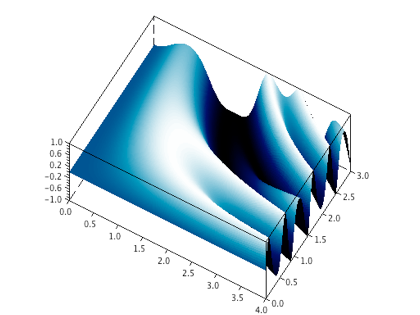
You can remove the lines on surface by using flag option. 1st prameter -1 means no line.
clf(); //To clear the previous plot
xset('colormap', oceancolormap(128));
funcprot(0); //nothing special is done when a function is redefined
deff('z = f(x, y)', 'z = sin(x * sin(x * y))');
x = linspace(0, 4, 500);
y = linspace(0, 3, 500);
z = feval(x, y, f); //returns the matrix z such as z(i,j)=f(x(i),y(j))
plot3d1(x, y, z, theta = 300, alpha = 30, leg = "@@", flag = [-1 6 4]);
Now I summarize the flag options.
flag = [mode, type, box]
mode
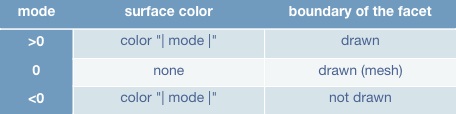
type
ebox = [xmin, xmax, ymin, ymax, zmin, zmax]
Here I don’t know the difference between 4 and 6 (or 3 and 5).
box
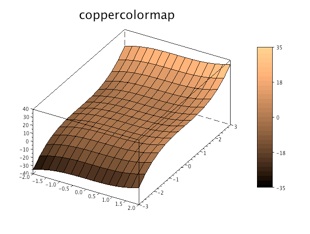
You can change the color by changing the 2nd parameter of ‘xset.’
clf(); //To clear the previous plot
xset('colormap', graycolormap(32))
funcprot(0); //nothing special is done when a function is redefined
deff('z = f(x, y)', 'z = x^3 + y^3')
x = linspace(-2, 2, 15);
y = linspace(-3, 3, 15);
z = feval(x, y, f); //returns the matrix z such as z(i,j)=f(x(i),y(j))
plot3d1(x, y, z, theta = 300, alpha = 3, leg="@@");
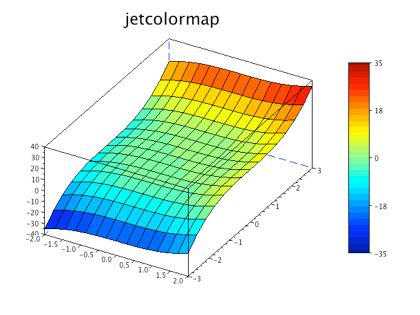
You can add the title and colorbar.
clf(); //To clear the previous plot
xset('colormap', jetcolormap(32));
funcprot(0); //nothing special is done when a function is redefined
deff('z = f(x, y)', 'z = x^3 + y^3');
x = linspace(-2, 2, 15);
y = linspace(-3, 3, 15);
z = feval(x, y, f); //returns the matrix z such as z(i,j)=f(x(i),y(j))
plot3d1(x, y, z, theta = 300, alpha = 3, leg = "@@", flag = [1 2 4]);
xtitle('jetcolormap');
a=gca(); //get the current axes
a.title.font_size = 5;
colorbar(min(z), max(z));
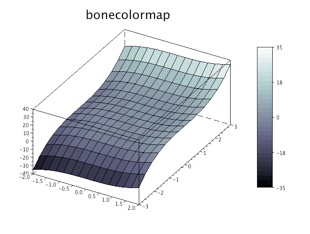
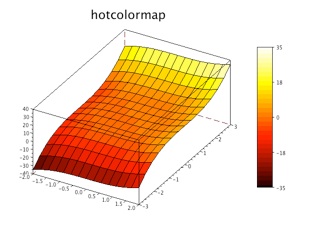
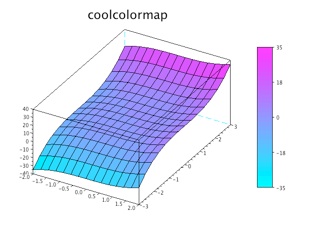
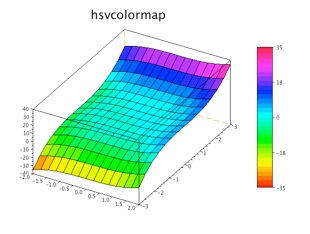
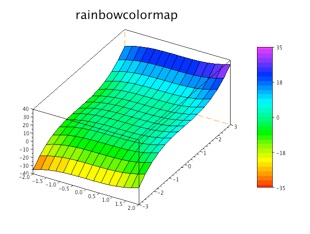
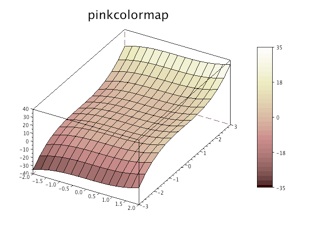
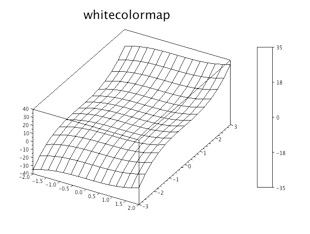
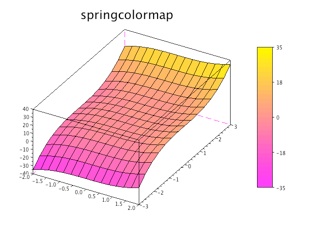
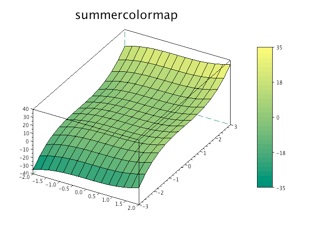
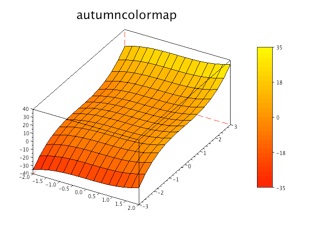
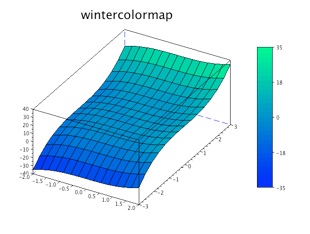
There are many color maps as below. I often use oceancolormap, pinkcolormap and jetcolormap.
There are many options in the axes_properties and surface_properties.
clf(); //To clear the previous plot
xset('colormap', oceancolormap(128));
funcprot(0); //nothing special is done when a function is redefined
deff('z = f(x, y)', 'z = sin(x + sin(y))');
x = linspace(0, 4*%pi, 30);
y = x;
z = feval(x, y, f); //returns the matrix z such as z(i,j)=f(x(i),y(j))
plot3d1(x, y, z, theta = 300, alpha = 80, leg = "@@", flag = [1 2 4]);
xtitle('$z=\sin(x+\sin y)$');
f = gcf();
n = size(f.color_map, "r"); //get the colormap size
a = gca(); //get the current axes
a.title.font_size = 4;
a.title.font_foreground = 1/5*n;
a.parent.background = 4/5*n;
a.background = 3/5*n;
a.grid = [4/5*n 4/5*n 4/5*n];
a.labels_font_color = 1/5*n;
a.box = "back_half";
a.tight_limits = "on";
clf(); //To clear the previous plot
funcprot(0); //nothing special is done when a function is redefined
deff('z = f(x, y)', 'z = x^3 + y^3');
x = linspace(-2, 2, 15);
y = linspace(-3, 3, 15);
z = feval(x, y, f); //returns the matrix z such as z(i,j)=f(x(i),y(j))
plot3d(x, y, z, theta = 300, alpha = 3, leg = "@@");
If you want to draw color level plot, you should use ‘plot3d1’ with xset('colormap', cmap)
clf(); //To clear the previous plot
xset('colormap', oceancolormap(32))
funcprot(0); //nothing special is done when a function is redefined
deff('z = f(x, y)', 'z = x^3 + y^3')
x = linspace(-2, 2, 15);
y = linspace(-3, 3, 15);
z = feval(x, y, f); //returns the matrix z such as z(i,j)=f(x(i),y(j))
plot3d1(x, y, z, theta = 300, alpha = 3, leg="@@");
If you draw the function as below, you are failed in describing details.
clf(); //To clear the previous plot
xset('colormap', oceancolormap(32));
funcprot(0); //nothing special is done when a function is redefined
deff('z = f(x, y)', 'z = sin(x * sin(x * y))');
x = linspace(0, 4, 15);
y = linspace(0, 3, 15);
z = feval(x, y, f); //returns the matrix z such as z(i,j)=f(x(i),y(j))
plot3d1(x, y, z, theta = 300, alpha = 30, leg = "@@", flag = [1 6 4]);
You should increase number of plot points for this function.
clf(); //To clear the previous plot
xset('colormap', oceancolormap(32));
funcprot(0); //nothing special is done when a function is redefined
deff('z = f(x, y)', 'z = sin(x * sin(x * y))');
x = linspace(0, 4, 50);
y = linspace(0, 3, 50);
z = feval(x, y, f); //returns the matrix z such as z(i,j)=f(x(i),y(j))
plot3d1(x, y, z, theta = 300, alpha = 30, leg = "@@", flag = [1 6 4]);
If you draw too many plot points, output graphic become black as below.
clf(); //To clear the previous plot
xset('colormap', oceancolormap(32));
funcprot(0); //nothing special is done when a function is redefined
deff('z = f(x, y)', 'z = sin(x * sin(x * y))');
x = linspace(0, 4, 500);
y = linspace(0, 3, 500);
z = feval(x, y, f); //returns the matrix z such as z(i,j)=f(x(i),y(j))
plot3d1(x, y, z, theta = 300, alpha = 30, leg = "@@", flag = [1 6 4]);
You can remove the lines on surface by using flag option. 1st prameter -1 means no line.
clf(); //To clear the previous plot
xset('colormap', oceancolormap(128));
funcprot(0); //nothing special is done when a function is redefined
deff('z = f(x, y)', 'z = sin(x * sin(x * y))');
x = linspace(0, 4, 500);
y = linspace(0, 3, 500);
z = feval(x, y, f); //returns the matrix z such as z(i,j)=f(x(i),y(j))
plot3d1(x, y, z, theta = 300, alpha = 30, leg = "@@", flag = [-1 6 4]);
Now I summarize the flag options.
flag = [mode, type, box]
mode
type
ebox = [xmin, xmax, ymin, ymax, zmin, zmax]
Here I don’t know the difference between 4 and 6 (or 3 and 5).
box
You can change the color by changing the 2nd parameter of ‘xset.’
clf(); //To clear the previous plot
xset('colormap', graycolormap(32))
funcprot(0); //nothing special is done when a function is redefined
deff('z = f(x, y)', 'z = x^3 + y^3')
x = linspace(-2, 2, 15);
y = linspace(-3, 3, 15);
z = feval(x, y, f); //returns the matrix z such as z(i,j)=f(x(i),y(j))
plot3d1(x, y, z, theta = 300, alpha = 3, leg="@@");
You can add the title and colorbar.
clf(); //To clear the previous plot
xset('colormap', jetcolormap(32));
funcprot(0); //nothing special is done when a function is redefined
deff('z = f(x, y)', 'z = x^3 + y^3');
x = linspace(-2, 2, 15);
y = linspace(-3, 3, 15);
z = feval(x, y, f); //returns the matrix z such as z(i,j)=f(x(i),y(j))
plot3d1(x, y, z, theta = 300, alpha = 3, leg = "@@", flag = [1 2 4]);
xtitle('jetcolormap');
a=gca(); //get the current axes
a.title.font_size = 5;
colorbar(min(z), max(z));
There are many color maps as below. I often use oceancolormap, pinkcolormap and jetcolormap.
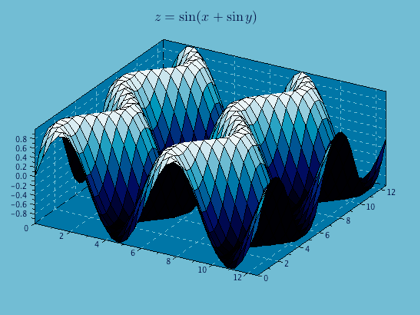
There are many options in the axes_properties and surface_properties.
clf(); //To clear the previous plot
xset('colormap', oceancolormap(128));
funcprot(0); //nothing special is done when a function is redefined
deff('z = f(x, y)', 'z = sin(x + sin(y))');
x = linspace(0, 4*%pi, 30);
y = x;
z = feval(x, y, f); //returns the matrix z such as z(i,j)=f(x(i),y(j))
plot3d1(x, y, z, theta = 300, alpha = 80, leg = "@@", flag = [1 2 4]);
xtitle('$z=\sin(x+\sin y)$');
f = gcf();
n = size(f.color_map, "r"); //get the colormap size
a = gca(); //get the current axes
a.title.font_size = 4;
a.title.font_foreground = 1/5*n;
a.parent.background = 4/5*n;
a.background = 3/5*n;
a.grid = [4/5*n 4/5*n 4/5*n];
a.labels_font_color = 1/5*n;
a.box = "back_half";
a.tight_limits = "on";
3D plots of two variable functions
2011/02/07
You can draw 3D plot of two variable functions by ‘plot3d1.’ There are 15 color maps in Scilab current version.
You can also change the view point, the number of plot points, etc.
When you choose the best parameters, the graphics become so beautiful one.


